Thursday, January 12, 2012

Review of Property Firms - Q311 Results

From Evernote:

Review of Property Firms - Q311 Results

Disclaimer: Please do your own due diligence when making decisions :)


Revenues
Sales is the starting point of all so let's start our review on this number. SMDC posted the highest increase in revenues compared to other companies reporting a 24% increase. MEG reported a small increase at 1%. I guess this is due to the fact that SMDC serves middle and lower income market. I interpret this as that there's a big market in middle and lower income group. It is important that revenues are increase because this means that the company is reporting growth. But i would like to caution that revenues is just a component. The gross margin plus operating expenses also comes into play for th profitability of  a company.

In terms of revenues in absolute peso, MEG still has the highest reported number

Gross Margin
MEG has the highest reported gross margin ratio followed by FLI. SMDC is trailing at 40.74%

Profit Margin on Sales
This number shows the amount of centavo a company converts to profit for each peso of revenue. MEG is still the company to beat at 32.44%. This means there's a 32 centavos for each P1 the company bills their customer. FLI follows at 28.34%. This is still a good number but the decreasing revenues of FLI worries me. It might be biased since we are only working with three quarters worth of revenue but comparing it with MEG and SMDC, these two companies were still able to increase their revenues. 

Return on Assets/Equity
Among the four companies, MEG still leads the competition by reporting the highest number of ROA/ROE followed closely by SMDC.


Summary
MEG is still the company to choose given its high profit margin on sales, ROA/ROE and positive cash flows. The company is a safe bet among the four. If one is to take a higher risk, SMDC looks promising with its increasing revenues. However, the company has to improve its operations to increase its profit margin on sales. Again, SMDC is talking a different territory so this is really promising. I particularly like SMDC because it is serving a different market thus it kinda has the first mover advantage for the market segment. (That reminds me, i should use forces of competition in next analysis). 

If you want to the details of each company please see here


Friday, January 6, 2012

VLL - Q311 Results

From Evernote:

VLL - Q311 Results


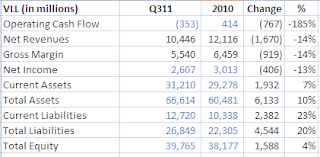
Vista Land's operations used cash for the period ended Q311. This is disappointing given that operations provided cash for the year 2010.  Revenues of the company declined by 14% compared with 2010. Though this is a declined the company still has one quarter to surpass last year's mark. Looking at the comparison above, it appears that the company is well poised to surpass last year's revenue.

Gross Margin remained flat at 53.03% same with Profiit Margin on Sales at 24.96%. Even these numbers did not improved, we can credit the management for being consistent. 

Return on Assets and Equity are slightly lower than last year's but considering the increase in assets and equity, these numbers are not that bad.


Thursday, January 5, 2012

SMDC - Q311 Results

SMDC - Q311 Results


SMDC reports a very interesting Q311 results. Operations still consumes cash and as of the period ended Q311, it exceeded last years outflow by P1M.
Normally, we want cash flows from operations to be positive. This means that the company operates and able to provide needed cash for it to continue. Nevertheless, the revenues of the company grew by 24% at the end of the third quarter. Given that the fourth quarter results were not yet released, we expect the company to report more than 24% growth in revenues. 

Gross Profit Margin is down to 40.74% compared with last years 44.71%

Net Income was also down most probably due to lower gross margin and higher operating expenses. Profit Margin on Sales was just 22.68% for the period ending Q311 while the company was able to report 33.14% last year. Profit Margin on Sales can be interpreted as the centavo earned for each peso of sale after deducting all the expenses.
Return on Assets and Return on Equity were down as well. This is not entirely bad news because one factor for these returns is the total assets and investment of owners. Assets and investment by owners increased thus dragging the ratio down. 

Wednesday, January 4, 2012

FilInvest Land: Q311 Results

From Evernote:

FilInvest Land: Q311 Results


Disclaimer:  Though i have performed diligence to make sure that my basis are reasonable, i suggest you also do your own due diligence when making decisions.


Filinvest Land's Q311 results is not good to the eyes. Though the amount of cash used in operations decreased, the net revenues for the period ending Q311 is not spectacular. Given that the four quarter results is yet to be released, 2011 revenues appear to be just equal to 2010 results. 

Gross margin also declined slightly from 61% to 58.32%

Return on Assets and Equity are also disappointing. Both ratios declined from 2010 to a reported value of 2.49% and 3.92%.


Tuesday, January 3, 2012

MEGAWORLD - Q311 Results

MEGAWORLD - Q311 Results

Finally, was able to set aside a few minutes to do this analysis. Similar with my previous post, a disclaimer. I have performed my analysis for my own use by relying on data downloaded from the PSE website. Though i have performed diligence to make sure that my basis are reasonable, i suggest you also do your own due diligence when making decisions.

Now, that i have that out of the way, the first focus stock is Megaworld.


Looking at the numbers above, MEG continues to report positive financial results. The operations is generating positive cash flows. Also, net revenues increased by 1%. I don't have data as to their target but I interpret this as positive because the revenues here is only for the first three quarter of the year. Definitely, Megaword's 2011 revenues will exceed that of their 2010 reported revenues.

In terms of Gross Profit Margin, it has also improved considerably from 45.66% to 64.59%. 

Return on Assets and Return on Equity showed improved results though very minimal. 

Total Assets increased both due to positive results of operation and increase in liabilities. As of Q311, Debt-Equity ratio was at 79.13% compared to 65.81%.


Related Posts Plugin for WordPress, Blogger...